According the Principles and Standards for School Mathematics, students at the 8th grade level should be able to work with relations and functions and to recognize the patterns found within them. The focus at the 8th grade level is on linear relationships with some quadratic included. Students will use variables and other algebraic symbols to represent information in problems, and write and solve a variety of mathematic sentences using algebraic manipulation and problem solving.
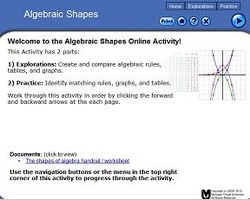
Algebraic Shapes
This web applet allows students to explore various algebraic equations and how their tables and graphs are changed by how the rule is written. By having students focus only on filling in the table correctly and showing them each point on the graph as it corresponds with the input and output in the table, students are able to focus on the relationship between the three representations rather than focusing on creating them correctly. The technology involved allows this focus on the goal of the activity, which is to make connections between various function rules and to learn to predict what shape a graph will have or which in a group will be different from the others based on either the function rule or the table view. This learning happens as students learn to see how each piece of the equation affects the outputs in the table and the graphical representation. Within the eighth grade, an increased amount of algebra concepts are focused on, especially in terms of linear functions. By beginning with a group of linear functions and continuing through five different families of functions, teachers can choose to have students focus on either just what they will see in this year’s curriculum or to have a snapshot of what is to come—which is how I would recommend using it.
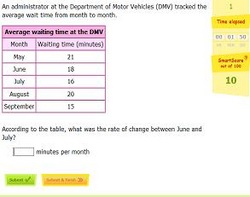
Rate of Change
By incorporating several ways of looking at rates of change (graphs, tables, descriptions, algebraic models), students who visit this site are able to focus on pattern finding quickly and to draw conclusions about how each is changing over time. When a graph is given for example, questions are directed towards specific parts of the graph, over a certain domain at a time. From this, students learn to read the problem for the desired information and to hone in on what is important for answering the question. This happens as students are allowed to find for their selves what the desired answer is and to ignore the overall picture. The technology is useful for being able to change quickly the image before the student and to provide response as to the correctly of the response immediately. In addition, when the response of the student is incorrect, students are provided with explanation of what they should have looked at in the problem to answer the question. The idea of rate of change is very important to eighth grade students as they become more adept at analyzing large quantities of information in a variety of forms and trying to pay attention to constant or changing rates. This skill will help apply to the linear unit of focus as students locate the rate of change and relate it to slope in a graph, table, function rule, or situation.
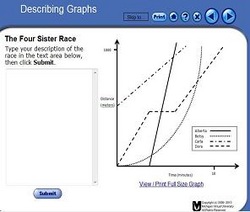
Four Sisters Race
This activity helps students consider various rates of change without having to focus on the number aspect. Instead, the attention is on slope from a comparison point of view; students look at position of start and end and have to read the axes to understand how the results of the race really came to be. This learning takes place as students read the information about start and end of the race and think critically about what the various changes in steepness or flat-lining really mean in terms of the race. After students determine what they think happened, they are able to check their description with another. By doing this, students not only can see if they are correct but they also get to read a very well-written description and hopefully improve their own. The technology is fairly simple and is really there as a way to record answers and display information. The site itself is not particularly dynamic in nature. This activity fits in the algebra section of the eighth grade as students are supposed to gain better understanding of slope and its connection to the real world. By completing this activity students are learning that real data can be displayed using lines on graphs and that this really is the same as the slope they work with while studying linear functions without the real world applications.
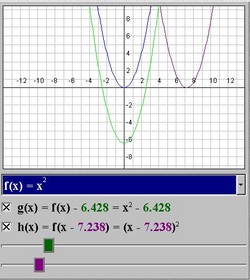
Function Transformations
Students learn about transformations of several function families by moving sliders in this activity. The focus is on vertical and horizontal translations. The information is shown by keeping the parent function visible and color-coding each function so that students can watch how their changing of a certain part of the function affects the graph. The idea is that students will increase or decrease the value and notice how the change affects each. This technology performs a similar action to some graphing calculators but does so with the computer with measurements of movements down to small decimals. Students do not have to perform any of the calculators or even understand how to really plug values in, but instead just focus on the affect on the shape of the overall graph. At the eighth grade level, students focus mostly on the linear function family. But as students go forth into mathematics, it will be important that students understand the various shapes of the graphs and the overall trend of translating those functions vertically or horizontally by where values are changes in the function rule.
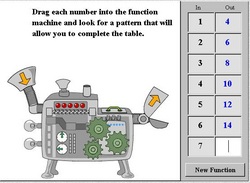
Function Machine
Students who use this applet practice the art of writing function rules for raw data by learning to read a table of values and understand the connection between each input and output. By allowing students to put the inputs into the machine in any order, it is emphasized that the relationship should be realized across the rows of the table—between the x and y coordinates of the graph—and not the trend down the columns when placed in increasing order, which is how most students try to find them. Students learn to focus their attention on the pairs and to find rules which work for all values shown by then guessing the outputs for inputs given to them. I have played this game and called it “I say, you say” before and students have really enjoyed it. The benefit to the technology though is that each student can play the game for their selves and do not need a partner. Furthermore, all the work is checked for them and they can try infinitely until the correct result is reached. This activity is a good lead in for students trying to write function rules for data that they find through an experiment, which will thus be recorded in a table. It also helps students work on their pattern finding, which is an important skill for students to carry forward in their entire mathematics career.
