According the Principles and Standards for School Mathematics, students at the 8th grade level should be able to classify and describe the relationships between various two- and three-dimensional objects and determine measurements involving area, perimeter, and volume concepts. An emphasis is placed on the student's ability to use spacial reasoning skills to visualize transformations and manipulations of common polygons and polyhedrons. Students will use a variety of tools and systems and apply various measurement systems to do so.
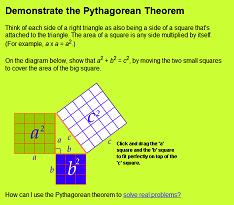
Demonstrating the Pythagorean Theorem
By using this applet to help students understand better how the Pythagorean Theorem works, students are able to see visually how several parts of the theorem come together visually. The best part of the learning is that students can see how the exact number of squares matches between the smaller two squares and the largest one. I have seen this proof created visually in other ways, but the advantage here with having it through the technology is that students can watch it happening in addition to having what is going on be explained to them. Learning takes place as students follow directions and see what happens to the area formed as they do so. Each step is explained in a very user-friendly approach so that a concept that may normally seem difficult or advanced becomes more obtainable. The technology involved is fairly simple; the flash software streamlines the activity so that students can focus on the concept more than having to write the proof or come up with it on their own. Being able to understand and follow the proof is extremely important for students at this level because it is building the basis for being able to comprehend as well as explain their thinking. As eighth grade students this concept is likely just developing but will set the stage for much of their future experiences with geometric concepts.
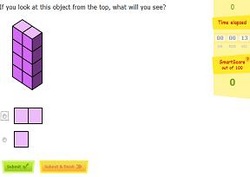
Front, Side, and Top Views
Although this activity assumes students have already learned the concept of isometric drawings, it creates an easy platform for students to work with the various views of structures. Students learn to focus their sight on certain parts of what they are looking at rather than seeing an entire structure at once. The learning takes place through connecting pre-created images with buildings rather than having students do the sketching for their selves, it actually helps cement the concept better because it takes the fear of messing up in the sketching away from the activity and allows students to enjoy recognizing the images first. The technology is able to do a lot of pre-programmed work with mixing up the three-dimensional views of buildings rather than relying on teachers or textbooks to create enough different views. Students’ knowledge is still easily assessable but their drawing skills are put aside. The activity would fit well into curriculum when students are beginning to understand the connection between the three-dimensional polyhedron and the two-dimensional world used to represent them. Because it requires some pre-existing knowledge of the concept this activity could be integrated early on to help students recognize the different views and could be followed with students sketching the pieces on their own.
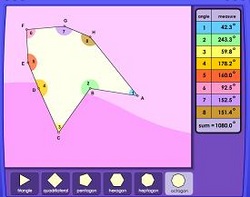
Angle Sums
Students are able to use this technology to explore the relationships between angle sums in several different polygons, both regular and irregular. On the simplest levels, students are able to see that the sum of the measures of the angles in each polygon remains the same regardless of how the locations of the vertices are manipulated within the shape itself. The deeper intent is that students will make the connection between the number of sides and the number of degrees in the polygon. The activity allows students to make many changes within the shapes given and to explore at their own pace how the changes affect the other angles. What many students probably do not think about ahead of time is how changing one vertex actually changes the two vertices adjacent to the one they drag. The technology involved makes this exploration possible, rather than requiring students to continuously measure the changes as they draw the shapes. Also, because the measurements are computed by the technology, measurements are displayed to the nearest tenth, which further cements the concept of them adding up to one fixed number. Angle sum concepts are important at this level because students are needing to understand the connections between these concepts and the ways that changes to different polygons are related.
| Lesson Directions |
| Lesson: Activity Sheet |
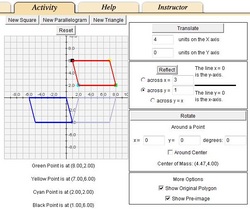
Transmographer
Studying transformations at the eighth grade level is difficult because students often have very little trouble understanding which transformation is which, but struggle with understanding the actual measurements of the movements. Understanding reflections over lines that are not adjacent to the object is difficult. Also, rotations about various center points are difficult for students at this age to visualize. This activity also students to learn about the composition of various translations and watch the transformations occur in stages. Students are able to choose which type of transformation is going to happen to the selected polygon and to what degree it is going to do so. By allowing students to make these decisions, the technology puts teachers in a place to either direct students through a series of transformations to an end result, or require students to come up with a series of transformations that will create a certain result. From both ends, the technology keeps students organized by using color changes to represent each image created and by helping students who might normally lack understanding due to an inability to sketch their drawings carefully and neatly enough. Transformations are a significant part of the geometry section of eighth grade curriculum expectations. By using an activity such as this one, teachers are able to summarize a lot of learning that has gone on or to introduce students to several ideas that are going to come all at once.
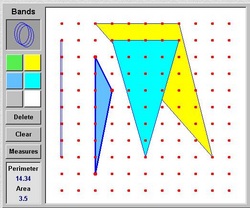
Geoboard
For teachers who do not have access to actual Geoboards, this activity is a fun way for students to be able to look at a variety of measurements for shapes that they create using the rubber bands. Students can create the polygons by dragging the vertexes in various directions and can also check the measurements of the shapes in terms of slopes of sides and perimeters of the polygons created. By doing this, students learn what it takes to create positive and negative slopes as well as maximize or minimize perimeter by manipulating a single part of the shape. The technology is neat because it is somewhat simple in design yet it allows students to do a lot of “playing around” with the measurements. Also, because it is the technology that also does the measuring, students are free to notice how what they do affects the length, rather than also having to worry about measuring correctly. This is an example of an activity that allows the teacher to hone in on what they are trying to assess, rather than having the students’ work be affected by their abilities or lack thereof with using a measuring tool. At the eighth grade, students are expected to understand the relationship between length of sides, number of sides, and area and perimeter. Students should also have an understanding of positive and negative slopes and the rate of change represented by various amounts of rise and run.
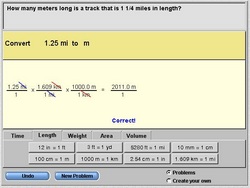
Converting Units
This activity focuses on the art of using dimensional analysis to convert between units of measurement. This concept in particular is one that I have often seen student’s struggle with, and I think a lot of this comes from a lack of understanding about what is really going on when students cross-reduce between the fractions. The activity allows students to find the correct conversions in the correct order, and even gives students the chance to think about which ratio (comparing the reciprocals of each) would be correct for the necessary reduction. The learning takes place as students try to find matches and at times correctly identify the ratio, but fail to choose the one that reduces. Students learn to watch for matching units that are in the numerator or denominator as needed the first time each time. The technology is cool because as the students focus on this idea of choosing conversions, the correct answer results in the applet actually cross-reducing for the student and performing any necessary calculations. Students can see their progress through the problem and do not become as burdened by the mathematics. Doing dimensional analysis is helpful for students who are studying proportionality and similarity, as students often need to change between units of measurement.
