According the Principles and Standards for School Mathematics, students at the 8th grade level should be able to understand basic methods of data collection and to organize information to display graphically. Students will be able to read and interpret the data collection of others and draw meaningful conclusions. Students will use basic terminology for situations involving basic probability and statistics correctly, and will learn to create and test inferences and predictions of their own.
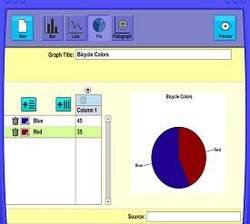
Data Grapher
Students in the 8th grade are expected to be able to not only conduct research but to display the results graphically in a variety of forms. An expansion to this activity would be to use the Advanced Data Grapher, which is created in the same family of online resources and allows students to create additional forms of graphs. Students learn from this how to organize data collected in a visually aesthetic way, which is good for students who are at an age where this does not come natural. By taking away the necessity of sketching and drawing the graphs by hand, students are able to focus on the data collection and the organization of the data instead. This technology allows teachers to be creative and unique with students as it is designed for easy input with basic manipulation of the graphs. The actual graph comes out quite similar to what could be created using Microsoft Excel but with fewer options, which simplifies the experience for students. Being able to communicate data at this age is important for students as they begin their algebra experience in high school.
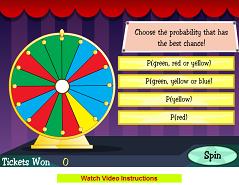
Probability Fair
Through this dynamic site which includes several forms of probability use, students play to win the most tickets by answering questions relating to probability. Because each game is set up carnival style, students become interested in playing very familiar games and activities. Students learn to view probability in a variety of formats and to compare the likelihoods of various events occurring with one another by combinations of events. The learning is focused on visual representations of the events. Everything that is described to potentially happen actually is performed right before the eyes of the students. The neat thing about the technology is that students no longer have to imagine flipping a coin twenty times. The technology displays this visually. It also displays other events, such as spinning a large spinning wheel that chooses various colors. It is designed to look at feel like the students are at a carnival, which is a very real representation of when probability comes into play in their lives, rather than talking about betting or horse racing or other less student-friendly tasks. Probability is a big topic in eight grade curriculum and again in Algebra 2. Because of this, the concept is what is most important so that students begin to think statistically and abstractly later on.
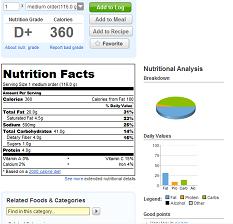
Calorie Counter
This site is a great resource for teachers to use with students who need to collect data. The idea of creating predictions and inferences about topics that students have some familiarity with and then actually being able to test those theories is important to student development as well as interest in learning. This site does so much “do” anything so much as it is a fantastic website full of research-worthy and interesting ideas for questions to be raised. Students learn to look for connections in data and to become curious about a topic that every living human considers: food. Because it is so close to home of a topic, every student can find something they are interested in whether it is fast food, fruits and vegetables or types of beverages. Students can learn to create hypothesis and to ask questions under the direction of a teacher and can go out and learn the answers for their selves for most any question they can think of in regards to what is in the foods they consume. In this sense, students learn independence and autonomy in their own learning and creation of an idea. This is all done by way of harmless exploration and searching. The only real use of technology on this site is the compellation of a lot of information in one place that is also easily searchable for information. However, it can go hand in hand with other technologies if teachers choose to have students take their data and research and apply it or display it in some other way. At the middle school level, students are very interest in those topics which fascinate them, and this would fit well into any unit on data collection or research and data display.
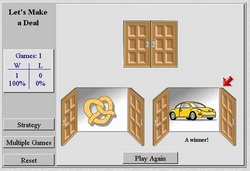
Stick or Switch
In this activity, students investigate the long-debated question from Let’s Make a Deal! Students learn about this application of probability by exploring their own wins and losses based off which door they originally choose and whether they decide to stick with the door after another is opened or switch. Part of the learning should take place early on in each trial, as the student should discover that with three doors to open, the door that is revealed after the choice is made will always show a fake prize and never the car (the desired prize). Because of this, students learn an important lesson in probability: Their chances of choosing the right door actually are 1/3 to start with. However, once the one door is opened, their chances are now ½, which is a greater probability. As the student starts to figure out the system and tries to answer the questions that accompany the activity, they should come to realize that the best choice is actually to switch every time. The technology used is simple yet it allows the student to try the experiment an infinite number of times. Because of this, it can be invaluable as students try to comprehend the idea at their own pace. This idea is actually fairly basic and fits in with the beginning of understanding compound probabilities at the 8th grade level. The ideas behind the activity, however, are actually much deeper, which is why I think it might be fun to use with this age of kids and enjoy the discussion that follows.
